There are a lot of symbols to identify and understand in the statistics. These symbols describe variables and any statistical data related to such variables. In the post, you’ll find all the necessary information about these terms and how they relate.
We’ve compiled this list for you if you want to learn more about some commonly used statistical symbols.
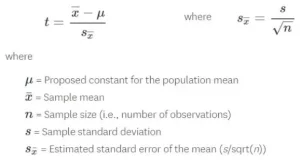
What does ”n” mean in statistics?
The letter “n” usually refers to the sample size. For example, if you find out how many people in your community are obese, you will need a sample of 100 people.
You would then calculate the percentage of people who are obese and compare it with the percentage of adults who are obese in your community.
The sample size is key because it affects your confidence in the data you collect. If you have too few people in your sample, then it’s possible that some of them might not accurately represent your population.
In other words, it’s possible that your results could be inaccurate or misleading because of small numbers. However, suppose your sample size is too large.
In that case, you won’t be able to accurately capture everyone in your community who has an interest in obesity or weight loss problems, and this might lead to overestimating those statistics.
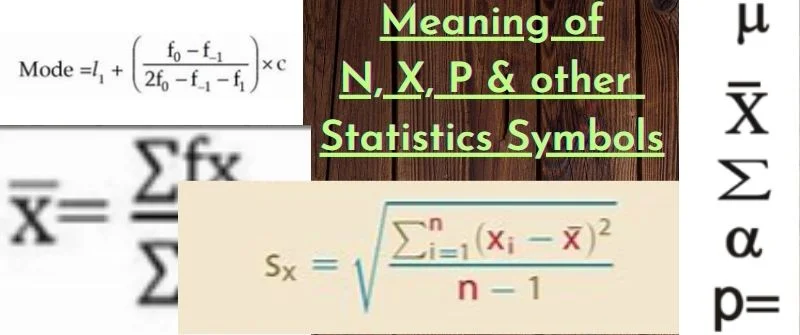
Meaning of X bar in Statistics
The X-bar is the average of the data set. It is a measure of the center of the data set. If you have a sample set of “n” numbers and want to calculate the mean, calculate each value in the sample and add them up. This will give you one number that represents your average.
For instance,
X bar is the mean value of a region. The mean is defined as:
Mean = Sum(X) / N
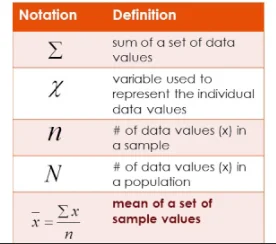
Where X is the sum of values in that region and ”n” is the number of observations within that region.
X bar represents the average value for each data point within a given area. It can demonstrate any statistical information about the data set.
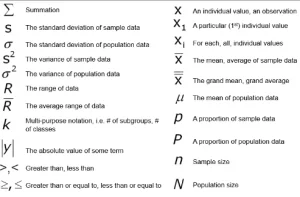
Meaning of P in Statistics
It stands for Probability which measures the likelihood that a random variable will take a specific value.
Probability is not about what we “expect” to happen but how likely something will occur in a particular situation.
The most common thing people misunderstand about probability is that it’s about predicting the future.
For example, if we measured students’ performance on a test and found that boys scored lower than girls, we could calculate whether there was a difference between the two groups. If so, we’d want to know what proportion of boys scored lower than their female peers and the proportion of girls who got higher scores.
But first, we need to estimate that proportion — how many boys did get lower scores than girls? That’s our estimate of P (BQ|D), which is the probability that boys score lower than girls, given that there is no difference in ability between them.
Meaning of ”n” in Statistics
In statistics, ”n” represents the sample’s total number of individuals or observations. For example, if we have a sample of 100 people and want to know how many are married, we would calculate Y = X + N.
N can be considered the number of rows in your data set. If you have 3 rows in your data set, then ”n” is 3. It’s also possible that your data set has 4 rows, but only 2 people have married. In this case, you would say that there are 4 “observations” (people) and 2 marriages (people getting married).
Meaning of other letters on statistics
- Xi – represents the all the x- values
- Xm- The Xm letters denote the values of a sample’s mean and standard deviation. These are the two most commonly used statistical measures, and they are incorporated into almost all statistical tests.
- V(x)- The V(x) letters in statistics mean that the variable is a vector. A vector is a collection of numbers (usually numbers in a particular order). In this case, the letters stand for a vector’s respective components.
- F-value -The f-value is the probability that a test statistic will have a value less than or equal to its observed value.
- Fx-The fx letters on statistics represent the frequency of a certain event in a sample. The fx letter is represented by the letter “f” with an attached number representing how many times the event occurred.
- F-test- The F-test compares two samples. If they are from the same population, there is no need for an adjustment for multiple comparisons. But if they are from different populations, we need to adjust for multiple comparisons because there could be more than one comparison group.
Understanding of different terms in statistics;
Mode
The mode of distribution is the most common value or value that occurs most often. For example, if you were to count the number of times each letter occurred in a word, the mode would be 1.
The mode is also called the most frequent value and occurs most frequently.
Variance
Variance measures how much a set of data is spread out. It is calculated by finding the square of the standard deviation.
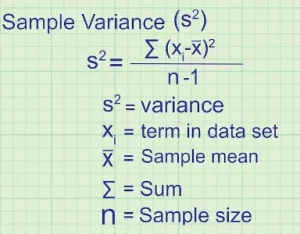
For example, if a data set’s mean and standard deviation are 5 and 2, the variance will be 10.
Population
The population is the total number of individuals living in a given area. A population consists of individuals, plants, and animals.
The size of a population depends on many factors, such as birth rate, death rate, migration rate, etc.
Dispersion
Dispersion measures the spread (or variability) of a set of data. It describes how far each value in the data set is from its mean.
Median
The middle score. If a data set contains an odd number of observations and the total number of scores in the data set is not evenly divisible by 2, then the median may not be a member of that set.
Data
Data is the raw material of statistics. We collect, analyze, and make decisions about our everyday lives
For more on that, you can watch this video.